symbolLayerDrawing and alternateSymbols — cased roads that hold together at the junction
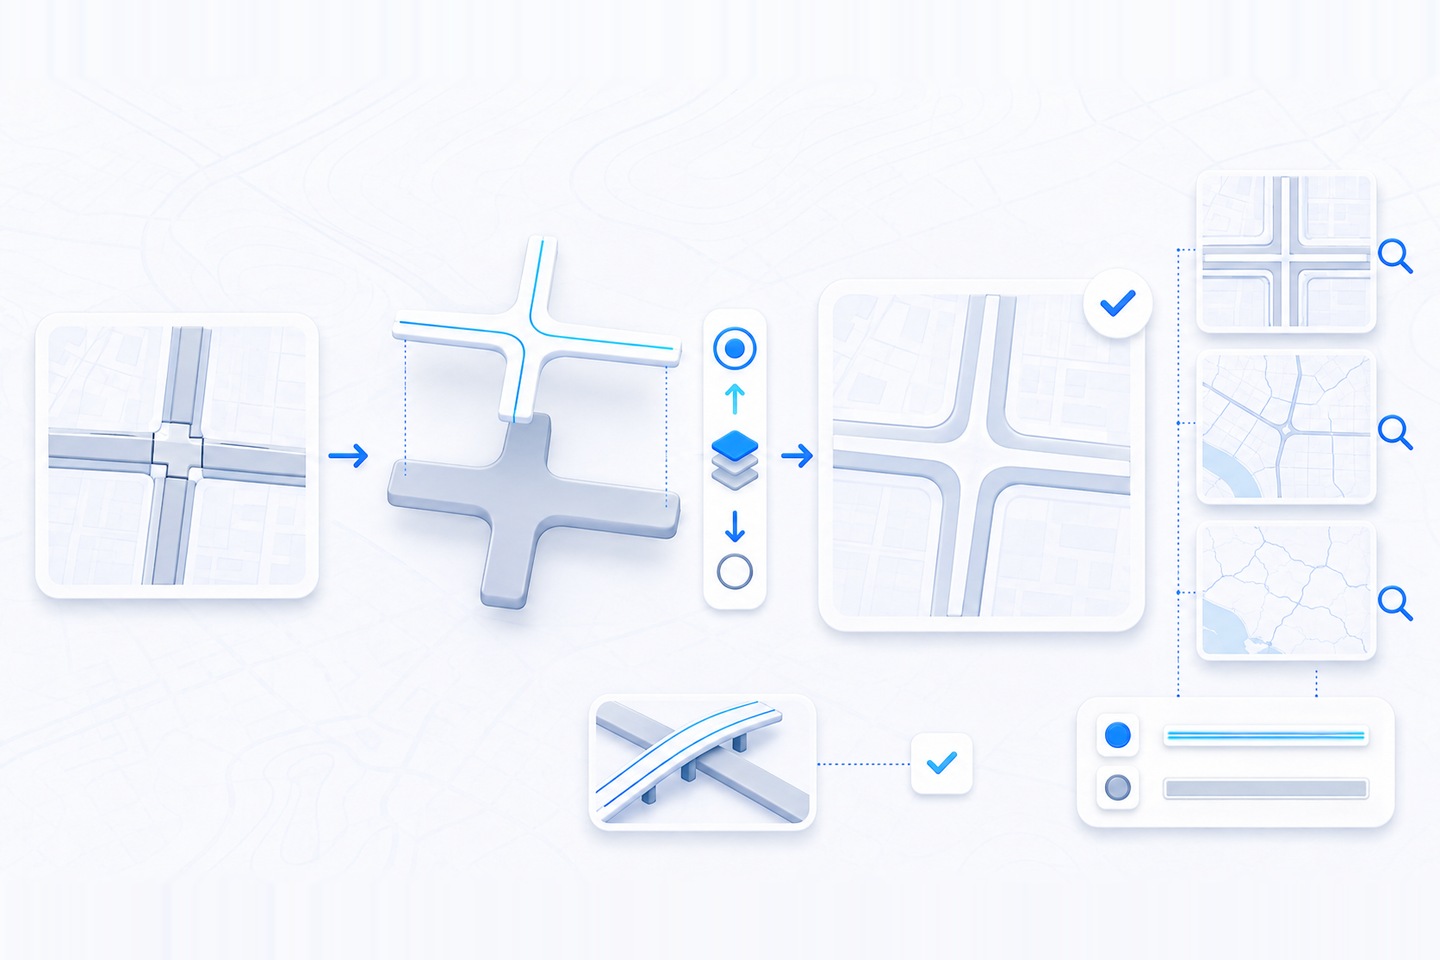
Publish a roads layer from ArcGIS Pro, open it on the web, and zoom to any intersection. If the roads are cased — a dark outer stroke with a lighter fill running down the middle, which is how nearly every road network in the world is drawn — you will often see a dark seam cutting straight across the road at the junction. Nothing is wrong with the data, the symbol, or the publish. The browser was drawing the symbol in the only order it had. Version 5.1 of the ArcGIS Maps SDK for JavaScript, released in June 2026, gives you the other order.
The seam at every junction
A cased road symbol is not one line. It is at least two, stacked: a wide dark stroke underneath, and a narrower light stroke on top of it. The dark one shows only at the edges, where the narrow stroke does not cover it, and that residue is what your eye reads as a casing. It is a two-layer illusion that has been the standard way to draw a road since long before any of this was on a screen.
The illusion depends entirely on stacking order, and the stacking has to hold across features, not just within one. Consider two road segments meeting at a T. If the renderer finishes the first segment completely — its casing, then its fill — and only then starts the second, the second segment’s casing lands on top of the first segment’s fill. That is the seam. It is not a rendering bug and it is not a missing pixel. It is the correct output of the wrong order.
Cartographers have known the fix for decades: draw every casing first, then draw every fill on top. Now the junction resolves, because no casing is ever painted after a fill. ArcGIS Pro has exposed this as symbol layer drawing for years. Until 5.1 the web SDK had no way to say it for a feature layer the browser draws itself.
What symbolLayerDrawing changes
FeatureLayer.symbolLayerDrawing arrived at 5.1 and takes a
SymbolLayerDrawing instance. The class has exactly two properties,
and both matter.
| Property | Type | What it does |
|---|---|---|
enabled |
boolean | Turns the override on. Defaults to false,
so setting drawOrder alone changes nothing. |
drawOrder |
string[] | Names the symbol layers in stacking order, top first. Per the reference, the values are drawn in the order listed, “with the first symbol layer drawn at the top and the last symbol layer drawn at the bottom.” |
Read that ordering rule twice, because it is the opposite of the way a lot of people describe a stack. First in the array is nearest the viewer. For a cased road you want the fill on top and the casing beneath it, so the fill is named first.
import FeatureLayer from "@arcgis/core/layers/FeatureLayer.js";
import SymbolLayerDrawing from "@arcgis/core/layers/support/SymbolLayerDrawing.js";

const roads = new FeatureLayer({ portalItem: { id: "…" } });

// First in the array draws on top. Fill above casing, for every feature in the layer.
roads.symbolLayerDrawing = new SymbolLayerDrawing({
  enabled: true,
  drawOrder: ["Road fill", "Road casing"]
});
The part that earns the feature is what the reference says next: when symbols have more than
one symbol layer, symbol layer drawing “can also control how those individual symbol
layers are ordered across symbol classes.” Across classes is the whole
point. Your roads layer probably has four or five classes — interstate, arterial,
collector, local — each with its own cased symbol. Ordering within one class was never
the problem. The problem was the collector’s casing landing on the arterial’s fill.
One drawOrder array applies to the whole layer. Where the classes
share symbol layer names — Road casing in all five —
one array orders all of them at once; where the names differ per class, plan on listing every
name you want positioned, in the order you want them drawn. What the reference specifies is that the values
correspond to the name of each symbol layer; it specifies nothing about how those names relate
across classes. So the sameness of them is a property of the symbols you authored, not
something the API arranges for you.
Be deliberate about what merging across classes costs you, because it is not free. On the
desktop side Esri distinguishes two behaviors: joining symbol classes so that
“higher symbol classes draw fully above lower ones, implying a vertical overpass,”
and joining and merging them to draw “all the road casings first, followed by a
consolidation of the fills.” Those are Pro’s terms, not the SDK’s. The
SymbolLayerDrawing reference has no join-or-merge setting and never
says which of the two drawOrder reproduces, so treat that pairing
as an inference from the Pro documentation rather than a documented equivalence. But a single
flat array applied across every class has no way to hold one class wholly above another, so
expect the merged result. It resolves the at-grade junction, and in the same move it sinks the
bridge’s casing beneath the fill of the road it crosses — which was the only thing
making the overpass read as an overpass. If your network has grade separations, test a
bridge, not just a T. Feature-level ordering is a different mechanism.
UniqueValueRenderer.orderByClassesEnabled has been available since
4.26; it is off by default, it applies in a MapView only, and the reference says
FeatureLayer.orderBy takes precedence over it.
The names in drawOrder are a contract
The strings in drawOrder are not free text and they are not
layer indices. The reference points at CIMSymbolLayer.name: a
symbol layer inside the CIM symbol may carry a name, and those are the names you list.
Read that “may” carefully — the property is typed
string | undefined and it is itself new at 5.1, so a symbol
authored before this release is not guaranteed to carry names at all. Unnamed symbol
layers are the first thing to check when drawOrder does
nothing. Where names do exist they are often something like
Road casing and Road fill, but they
come from whoever built the symbol and they are not standardized across organizations. A
symbol from a partner’s style file will use that partner’s names.
So read them, do not guess them. Load the layer, take the renderer’s symbol, and walk the CIM structure to see what the symbol layers are actually called:
// Continues from the module above. Read the names off the symbol rather than assuming them.
await roads.load();
const r = roads.renderer;
// The reference says uniqueValueGroups should be used in favor of uniqueValueInfos, but
// plenty of layers still carry the older shape - read whichever one this layer has.
const sym = r?.uniqueValueGroups?.[0]?.classes?.[0]?.symbol
         ?? r?.uniqueValueInfos?.[0]?.symbol;            // a CIMSymbol
const names = (sym?.data?.symbol?.symbolLayers ?? [])
  .map((L) => L.name)
  .filter(Boolean);                                     // name is optional
console.log(names);
That snippet assumes a UniqueValueRenderer, which is the usual
shape for a classed roads layer; a ClassBreaksRenderer exposes the
same symbols through classBreakInfos, and a single-symbol layer
through renderer.symbol. The nesting is the part worth noting:
CIMSymbol.data is a CIMSymbolReference,
and the symbol layers hang off the symbol inside it. The optional chaining is not
defensive decoration — a layer styled with a SimpleLineSymbol
has no data at all, and that is the case the second limit below is
about. An empty log means one of two different things: no CIM symbol, or a CIM symbol whose
layers were never named.
One honest gap, and it is worth stating rather than papering over: the reference
does not specify what happens when a name in drawOrder matches no
symbol layer. Nor does it specify what happens to a symbol layer whose name you leave
out of the array. Either may be ignored, either may drop that layer from the draw, and
it may vary by symbol. Do not design around a guess. So when an ordering result surprises you,
work the two checks in that order: first confirm the symbol layers carry names at all, then
confirm the names you listed are the ones on the symbol you are actually shipping. That
single habit — read the identifier from the object instead of typing what you
expect it to be — is the difference between a cartographic change you can hand to
somebody else and one only you can debug.
alternateSymbols: the same problem, three zoom levels out
The second half of the 5.1 symbology work solves a related complaint. Your beautifully cased roads are correct at 1:5,000 and absurd at 1:2,000,000, where the casing is wider than the county. The traditional answer is several renderers with scale dependencies, several layers in the map, and a maintenance problem where a symbol change has to be made in four places.
UniqueValueInfo.alternateSymbols — and the matching
properties on ClassBreakInfo and
UniqueValueClass — takes a
CIMSymbol[] and lets one renderer carry the whole scale ramp. The
constraints are specific and the reference is blunt about them: each alternate CIMSymbol
“must have a minScale or maxScale
defined,” and to make the ramp behave, “the symbol property should also be a
CIMSymbol with a minScale or maxScale defined.” The release notes put that second one
harder — the symbol on the renderer must be a CIMSymbol with a bound defined
— and they give the selection rule the reference leaves out: when the view is zoomed
past a symbol’s bounds, the renderer uses “the next symbol in the alternateSymbols
array that meets the scale criteria.” The scale bounds live inside the symbol, on the
CIMSymbolReference, not on the renderer.
// Still the same module: roads is the FeatureLayer created in the first block, and these two
// imports sit alongside the ones at the top of it.
import CIMSymbol from "@arcgis/core/symbols/CIMSymbol.js";
import UniqueValueRenderer from "@arcgis/core/renderers/UniqueValueRenderer.js";

const uniqueValueRenderer = new UniqueValueRenderer({ field: "ROAD_CLASS" });

// Inside symbolLayers, as in drawOrder, the first entry is the one nearest the viewer.
const fill   = (w) => ({ type: "CIMSolidStroke", name: "Road fill",   enable: true, width: w, color: [255, 255, 255, 255] });
const casing = (w) => ({ type: "CIMSolidStroke", name: "Road casing", enable: true, width: w, color: [60, 60, 60, 255] });

// uniqueValueInfos here mirrors the alternateSymbols example on the reference page. If you
// author uniqueValueGroups instead, the same property sits on UniqueValueClass.
uniqueValueRenderer.uniqueValueInfos = [
  {
    value: "Interstate",
    // Per the reference: used when the view's scale is less than 5,000,000.
    symbol: new CIMSymbol({
      data: { type: "CIMSymbolReference", minScale: 5000000, maxScale: 0,
              symbol: { type: "CIMLineSymbol",
                        symbolLayers: [fill(4), casing(8)] } }
    }),
    alternateSymbols: [
      // Per the reference: used when the view's scale is greater than 5,000,000. Thinner,
      // but carrying the same two names so one drawOrder array still covers this end.
      new CIMSymbol({
        data: { type: "CIMSymbolReference", minScale: 0, maxScale: 5000000,
                symbol: { type: "CIMLineSymbol",
                          symbolLayers: [fill(1.4), casing(2.6)] } }
      })
    ]
  }
];

roads.renderer = uniqueValueRenderer;
Two things about that block are easy to get wrong. The threshold is the reference’s
own 5,000,000, not a recommendation — the number you want is wherever your casing stops
reading, which on the roads layer this section opened with is nearer 1:2,000,000. And the alternate’s
symbol layers need the same names as the primary’s, or
drawOrder silently covers only part of your scale range and you are
back in the undocumented territory of the previous section. Keep the class distinction in the
simplified symbol too: dropping five classes to one identical stroke leaves color as the only
thing telling an arterial from a local road, which is a step backwards for anyone who cannot
rely on hue.
The release notes describe the payoff as “a more efficient way to render large datasets at smaller scales without having to create multiple renderers with different scale dependencies.” Efficiency is the stated benefit; the one that matters more to a reader looking at the map is that a simplified symbol at a small scale is simply better cartography than a casing collapsing into a smear.
What this looks like on a real roads layer
Take a county centerline layer — call it forty-odd thousand segments, five functional classes, cased symbology authored in Pro because that is where the cartography happened. Before 5.1 you had three options, and every one of them cost something:
- Ship the seams. Free, and it reads as amateur to exactly the audience that knows the difference — which, on a public-facing map, is the audience whose opinion of your organization you were trying to influence.
- Flatten the cartography. Drop the casing, ship single strokes. The junctions resolve because there is nothing to conflict, and you have thrown away the visual hierarchy that told a reader which road is the arterial.
- Split the layer. One layer drawing all the casings, a second drawing all the fills on top. This works, and it is what careful teams have been doing. It also doubles your requests, doubles the features in the browser, and gives you two layers to keep in sync forever — every symbol edit, every definition expression, every visibility toggle, done twice or done wrong.
Option three is the interesting one, because that is the workaround 5.1 retires. If you have
a casing layer paired with a fill layer in a production map, the pair is now a candidate for
collapse back into a single layer with symbolLayerDrawing enabled.
That is a real simplification with a real payoff in the browser, and it is the kind of thing
that never gets done because nothing ever forces it.
It is also a structural change to a shared item, so scope it as one. Before
anybody merges anything, walk the list: everything that references the second layer by its
id — dashboards, Experience Builder bindings, Instant Apps
configuration, print templates, findLayerById calls — breaks
silently, not loudly. Diff the two definition expressions; teams routinely filter the casing
layer to a subset, and one layer cannot reproduce that. Check the per-layer scale ranges, which
are often how the scale ramp was faked before alternateSymbols
existed. Check labels, popups and hit testing, all of which change identity when two layers
become one. And check for a third layer deliberately sandwiched between the casings and the
fills — hydrography, rail, a highlight layer — because
symbolLayerDrawing orders symbol layers within one feature layer and
cannot order across map layers, so a sandwiched layer makes the merge unavailable rather than
merely awkward. Name the item owner, agree a change window, and know how you would roll it
back. This is a scoped piece of work, not something to do while you happen to have the map
open.
There is a second, quieter consequence for anyone whose cartography starts in Pro. Per Esri’s release write-up, layers published from ArcGIS Pro with alternate symbols and symbol layer drawing “are also respected on web,” and symbol layer drawing “can be authored in Map Viewer as well.” The round trip closes. The cartographer’s decisions survive the publish instead of being approximated by a developer afterwards, which is a better division of labor than most web mapping stacks manage.
Four limits to plan around
- 2D only, both of them. The reference states plainly that symbol layer drawing “is not supported in 3D scenes,” and that alternate symbols “are only supported in 2D.” If your application has a scene view, this is a MapView-side improvement and the scene keeps the behavior it had. Do not promise a stakeholder a consistent look across both views on the strength of this release.
- CIMSymbol or nothing. Both features are CIM-symbol features. A layer
styled with a
SimpleLineSymbolhas no named symbol layers to order and no scale bounds to hang alternates from. Getting the benefit may mean moving the layer’s symbology to CIM first, and then naming every symbol layer in every class and every alternate — a larger piece of work thansymbolLayerDrawingandalternateSymbolssuggest. Scope it rather than guessing at it: export the symbol JSON and diff its symbol layer types against the support table on the CIMSymbol reference, which states plainly that not everything in the CIM specification is supported in the JavaScript SDK. Note also what does not cross over — ArcGIS Pro requires symbol layer drawing to be enabled before you can use symbol layer masking, and the SDK’sSymbolLayerDrawinghas exactly two properties, neither of which is masking. enableddefaults to false. Programmatic layers start with the old behavior. If a map is right in Map Viewer and wrong in your application, the layer construction is the first place to look, not the symbol.- Nothing about the draw-order change itself is a performance guarantee. The release notes call alternate symbols efficient at smaller scales, and that is a claim about avoiding redundant renderers, not a benchmark for your data. Whether regrouping draw order across a large layer helps or costs you at a given zoom is a question for your layer, in your application, measured properly: a repeatable trace over the same extent at the same three scales, cold cache and warm. Measure it before you quote a number to anyone.
Esri’s announcement post says 5.1 shipped “without breaking changes, so you can
upgrade with confidence.” Read the scope of that sentence: it describes 5.0 to 5.1. If
your application is on the 4.x line, as most production Maps SDK applications still are,
getting to 5.1 means crossing 5.0 first — module-only CDN loading, the end of
dojoConfig.locale and require(), and
the deprecation of every widget ahead of removal at 6.0. That crossing is the first of the two
schedule questions the box above names, and on most teams it is the larger one, so price it
before you price the symbology. If you are already on 5.0 and the symbology is already CIM,
it genuinely is an afternoon: one layer, and the difference shows at the first intersection
you zoom to. Start there. Turn it on for the roads layer that has been quietly embarrassing
you, look at a junction, and decide from the map rather than from the changelog.
References
- SymbolLayerDrawing reference (enabled, drawOrder, the first-is-top ordering rule and the 3D exclusion)
- FeatureLayer reference (symbolLayerDrawing, the property that carries it on the layer)
- UniqueValueInfo reference (alternateSymbols, the minScale/maxScale requirement and the documented example)
- CIM types reference (CIMSymbolLayer.name, which is what the strings in drawOrder refer to)
- UniqueValueRenderer reference (uniqueValueGroups over uniqueValueInfos, and orderByClassesEnabled: since 4.26, false by default, MapView only, outranked by orderBy)
- CIMSymbol reference (the data property and the CIMSymbolReference wrapper the scale bounds live on)
- Release notes for 5.1 (the June 2026 release this article is verified against)
- Sample: CIMSymbol lines and polygons (a running construction of multi-layer CIM line symbology)
- ArcGIS Pro: symbol layer drawing (the desktop feature this mirrors, the source of the Join / Join and Merge wording, and the page the SDK reference itself links to)
- What is new in 5.1 (the Pro-published and Map Viewer authoring statements, and the no-breaking-changes note)
Does your web map look like your Pro map?
We build and review ArcGIS Maps SDK applications where the cartography is held to the same bar as the data — symbology that survives the publish, junctions that resolve, and a scale ramp somebody actually designed. Book a free intro call and we will look at one of your maps and tell you what is fixable and what it would take.
Book a free intro call